| Valgrind User Manual |
|---|
| Valgrind User Manual |
|---|
Table of Contents
This chapter describes the Valgrind core services, command-line options and behaviours. That means it is relevant regardless of what particular tool you are using. The information should be sufficient for you to make effective day-to-day use of Valgrind. Advanced topics related to the Valgrind core are described in Valgrind's core: advanced topics.
A point of terminology: most references to "Valgrind" in this chapter refer to the Valgrind core services.
Valgrind is designed to be as non-intrusive as possible. It works directly with existing executables. You don't need to recompile, relink, or otherwise modify the program to be checked.
You invoke Valgrind like this:
valgrind [valgrind-options] your-prog [your-prog-options]
The most important option is --tool which dictates
which Valgrind tool to run. For example, if want to run the command
ls -l using the memory-checking tool
Memcheck, issue this command:
valgrind --tool=memcheck ls -l
However, Memcheck is the default, so if you want to use it you can
omit the --tool option.
Regardless of which tool is in use, Valgrind takes control of your program before it starts. Debugging information is read from the executable and associated libraries, so that error messages and other outputs can be phrased in terms of source code locations, when appropriate.
Your program is then run on a synthetic CPU provided by the Valgrind core. As new code is executed for the first time, the core hands the code to the selected tool. The tool adds its own instrumentation code to this and hands the result back to the core, which coordinates the continued execution of this instrumented code.
The amount of instrumentation code added varies widely between tools. At one end of the scale, Memcheck adds code to check every memory access and every value computed, making it run 10-50 times slower than natively. At the other end of the spectrum, the minimal tool, called Nulgrind, adds no instrumentation at all and causes in total "only" about a 4 times slowdown.
Valgrind simulates every single instruction your program executes. Because of this, the active tool checks, or profiles, not only the code in your application but also in all supporting dynamically-linked libraries, including the C library, graphical libraries, and so on.
If you're using an error-detection tool, Valgrind may
detect errors in system libraries, for example the GNU C or X11
libraries, which you have to use. You might not be interested in these
errors, since you probably have no control over that code. Therefore,
Valgrind allows you to selectively suppress errors, by recording them in
a suppressions file which is read when Valgrind starts up. The build
mechanism selects default suppressions which give reasonable
behaviour for the OS and libraries detected on your machine.
To make it easier to write suppressions, you can use the
--gen-suppressions=yes option. This tells Valgrind to
print out a suppression for each reported error, which you can then
copy into a suppressions file.
Different error-checking tools report different kinds of errors. The suppression mechanism therefore allows you to say which tool or tool(s) each suppression applies to.
First off, consider whether it might be beneficial to recompile
your application and supporting libraries with debugging info enabled
(the -g option). Without debugging info, the best
Valgrind tools will be able to do is guess which function a particular
piece of code belongs to, which makes both error messages and profiling
output nearly useless. With -g, you'll get
messages which point directly to the relevant source code lines.
Another option you might like to consider, if you are working with
C++, is -fno-inline. That makes it easier to see the
function-call chain, which can help reduce confusion when navigating
around large C++ apps. For example, debugging
OpenOffice.org with Memcheck is a bit easier when using this option. You
don't have to do this, but doing so helps Valgrind produce more accurate
and less confusing error reports. Chances are you're set up like this
already, if you intended to debug your program with GNU GDB, or some
other debugger. Alternatively, the Valgrind option
--read-inline-info=yes instructs Valgrind to read
the debug information describing inlining information. With this,
function call chain will be properly shown, even when your application
is compiled with inlining.
If you are planning to use Memcheck: On rare
occasions, compiler optimisations (at -O2
and above, and sometimes -O1) have been
observed to generate code which fools Memcheck into wrongly reporting
uninitialised value errors, or missing uninitialised value errors. We have
looked in detail into fixing this, and unfortunately the result is that
doing so would give a further significant slowdown in what is already a slow
tool. So the best solution is to turn off optimisation altogether. Since
this often makes things unmanageably slow, a reasonable compromise is to use
-O. This gets you the majority of the
benefits of higher optimisation levels whilst keeping relatively small the
chances of false positives or false negatives from Memcheck. Also, you
should compile your code with -Wall because
it can identify some or all of the problems that Valgrind can miss at the
higher optimisation levels. (Using -Wall
is also a good idea in general.) All other tools (as far as we know) are
unaffected by optimisation level, and for profiling tools like Cachegrind it
is better to compile your program at its normal optimisation level.
Valgrind understands the DWARF2/3/4 formats used by GCC 3.1 and later. The reader for "stabs" debugging format (used by GCC versions prior to 3.1) has been disabled in Valgrind 3.9.0.
When you're ready to roll, run Valgrind as described above.
Note that you should run the real
(machine-code) executable here. If your application is started by, for
example, a shell or Perl script, you'll need to modify it to invoke
Valgrind on the real executables. Running such scripts directly under
Valgrind will result in you getting error reports pertaining to
/bin/sh,
/usr/bin/perl, or whatever interpreter
you're using. This may not be what you want and can be confusing. You
can force the issue by giving the option
--trace-children=yes, but confusion is still
likely.
Valgrind tools write a commentary, a stream of text, detailing error reports and other significant events. All lines in the commentary have following form:
==12345== some-message-from-Valgrind
The 12345 is the process ID.
This scheme makes it easy to distinguish program output from Valgrind
commentary, and also easy to differentiate commentaries from different
processes which have become merged together, for whatever reason.
By default, Valgrind tools write only essential messages to the
commentary, so as to avoid flooding you with information of secondary
importance. If you want more information about what is happening,
re-run, passing the -v option to Valgrind. A second
-v gives yet more detail.
You can direct the commentary to three different places:
The default: send it to a file descriptor, which is by default
2 (stderr). So, if you give the core no options, it will write
commentary to the standard error stream. If you want to send it to
some other file descriptor, for example number 9, you can specify
--log-fd=9.
This is the simplest and most common arrangement, but can cause problems when Valgrinding entire trees of processes which expect specific file descriptors, particularly stdin/stdout/stderr, to be available for their own use.
A less intrusive
option is to write the commentary to a file, which you specify by
--log-file=filename. There are special format
specifiers that can be used to use a process ID or an environment
variable name in the log file name. These are useful/necessary if your
program invokes multiple processes (especially for MPI programs).
See the basic options section
for more details.
The
least intrusive option is to send the commentary to a network
socket. The socket is specified as an IP address and port number
pair, like this: --log-socket=192.168.0.1:12345 if
you want to send the output to host IP 192.168.0.1 port 12345
(note: we
have no idea if 12345 is a port of pre-existing significance). You
can also omit the port number:
--log-socket=192.168.0.1, in which case a default
port of 1500 is used. This default is defined by the constant
VG_CLO_DEFAULT_LOGPORT in the
sources.
Note, unfortunately, that you have to use an IP address here, rather than a hostname.
Writing to a network socket is pointless if you don't
have something listening at the other end. We provide a simple
listener program,
valgrind-listener, which accepts
connections on the specified port and copies whatever it is sent to
stdout. Probably someone will tell us this is a horrible security
risk. It seems likely that people will write more sophisticated
listeners in the fullness of time.
valgrind-listener can accept
simultaneous connections from up to 50 Valgrinded processes. In front
of each line of output it prints the current number of active
connections in round brackets.
valgrind-listener accepts three
command-line options:
-e --exit-at-zeroWhen the number of connected processes falls back to zero, exit. Without this, it will run forever, that is, until you send it Control-C.
--max-connect=INTEGERBy default, the listener can connect to up to 50 processes.
Occasionally, that number is too small. Use this option to
provide a different limit. E.g.
--max-connect=100.
portnumberChanges the port it listens on from the default (1500).
The specified port must be in the range 1024 to 65535.
The same restriction applies to port numbers specified by a
--log-socket to Valgrind itself.
If a Valgrinded process fails to connect to a listener, for whatever reason (the listener isn't running, invalid or unreachable host or port, etc), Valgrind switches back to writing the commentary to stderr. The same goes for any process which loses an established connection to a listener. In other words, killing the listener doesn't kill the processes sending data to it.
Here is an important point about the relationship between the
commentary and profiling output from tools. The commentary contains a
mix of messages from the Valgrind core and the selected tool. If the
tool reports errors, it will report them to the commentary. However, if
the tool does profiling, the profile data will be written to a file of
some kind, depending on the tool, and independent of what
--log-* options are in force. The commentary is
intended to be a low-bandwidth, human-readable channel. Profiling data,
on the other hand, is usually voluminous and not meaningful without
further processing, which is why we have chosen this arrangement.
When an error-checking tool detects something bad happening in the program, an error message is written to the commentary. Here's an example from Memcheck:
==25832== Invalid read of size 4
==25832==    at 0x8048724: BandMatrix::ReSize(int, int, int) (bogon.cpp:45)
==25832==    by 0x80487AF: main (bogon.cpp:66)
==25832==  Address 0xBFFFF74C is not stack'd, malloc'd or free'd
This message says that the program did an illegal 4-byte read of
address 0xBFFFF74C, which, as far as Memcheck can tell, is not a valid
stack address, nor corresponds to any current heap blocks or recently freed
heap blocks. The read is happening at line 45 of
bogon.cpp, called from line 66 of the same file,
etc. For errors associated with an identified (current or freed) heap block,
for example reading freed memory, Valgrind reports not only the
location where the error happened, but also where the associated heap block
was allocated/freed.
Valgrind remembers all error reports. When an error is detected, it is compared against old reports, to see if it is a duplicate. If so, the error is noted, but no further commentary is emitted. This avoids you being swamped with bazillions of duplicate error reports.
If you want to know how many times each error occurred, run with
the -v option. When execution finishes, all the
reports are printed out, along with, and sorted by, their occurrence
counts. This makes it easy to see which errors have occurred most
frequently.
Errors are reported before the associated operation actually happens. For example, if you're using Memcheck and your program attempts to read from address zero, Memcheck will emit a message to this effect, and your program will then likely die with a segmentation fault.
In general, you should try and fix errors in the order that they are reported. Not doing so can be confusing. For example, a program which copies uninitialised values to several memory locations, and later uses them, will generate several error messages, when run on Memcheck. The first such error message may well give the most direct clue to the root cause of the problem.
The process of detecting duplicate errors is quite an
expensive one and can become a significant performance overhead
if your program generates huge quantities of errors. To avoid
serious problems, Valgrind will simply stop collecting
errors after 1,000 different errors have been seen, or 10,000,000 errors
in total have been seen. In this situation you might as well
stop your program and fix it, because Valgrind won't tell you
anything else useful after this. Note that the 1,000/10,000,000 limits
apply after suppressed errors are removed. These limits are
defined in m_errormgr.c and can be increased
if necessary.
To avoid this cutoff you can use the
--error-limit=no option. Then Valgrind will always show
errors, regardless of how many there are. Use this option carefully,
since it may have a bad effect on performance.
The error-checking tools detect numerous problems in the system
libraries, such as the C library,
which come pre-installed with your OS. You can't easily fix
these, but you don't want to see these errors (and yes, there are many!)
So Valgrind reads a list of errors to suppress at startup. A default
suppression file is created by the
./configure script when the system is
built.
You can modify and add to the suppressions file at your leisure, or, better, write your own. Multiple suppression files are allowed. This is useful if part of your project contains errors you can't or don't want to fix, yet you don't want to continuously be reminded of them.
Note: By far the easiest way to add
suppressions is to use the --gen-suppressions=yes option
described in Core Command-line Options. This generates
suppressions automatically. For best results,
though, you may want to edit the output
of --gen-suppressions=yes by hand, in which
case it would be advisable to read through this section.
Each error to be suppressed is described very specifically, to minimise the possibility that a suppression-directive inadvertently suppresses a bunch of similar errors which you did want to see. The suppression mechanism is designed to allow precise yet flexible specification of errors to suppress.
If you use the -v option, at the end of execution,
Valgrind prints out one line for each used suppression, giving the number of times
it got used, its name and the filename and line number where the suppression is
defined. Depending on the suppression kind, the filename and line number are optionally
followed by additional information (such as the number of blocks and bytes suppressed
by a Memcheck leak suppression). Here's the suppressions used by a
run of valgrind -v --tool=memcheck ls -l:
--1610-- used_suppression:      2 dl-hack3-cond-1 /usr/lib/valgrind/default.supp:1234
--1610-- used_suppression:      2 glibc-2.5.x-on-SUSE-10.2-(PPC)-2a /usr/lib/valgrind/default.supp:1234
Multiple suppressions files are allowed. Valgrind loads suppression
patterns from $PREFIX/lib/valgrind/default.supp unless
--default-suppressions=no has been specified. You can
ask to add suppressions from additional files by specifying
--suppressions=/path/to/file.supp one or more times.
If you want to understand more about suppressions, look at an
existing suppressions file whilst reading the following documentation.
The file glibc-2.3.supp, in the source
distribution, provides some good examples.
Blank and comment lines in a suppression file are ignored. Comment lines are made of 0 or more blanks followed by a # character followed by some text.
Each suppression has the following components:
First line: its name. This merely gives a handy name to the suppression, by which it is referred to in the summary of used suppressions printed out when a program finishes. It's not important what the name is; any identifying string will do.
Second line: name of the tool(s) that the suppression is for (if more than one, comma-separated), and the name of the suppression itself, separated by a colon (n.b.: no spaces are allowed), eg:
tool_name1,tool_name2:suppression_name
Recall that Valgrind is a modular system, in which different instrumentation tools can observe your program whilst it is running. Since different tools detect different kinds of errors, it is necessary to say which tool(s) the suppression is meaningful to.
Tools will complain, at startup, if a tool does not understand any suppression directed to it. Tools ignore suppressions which are not directed to them. As a result, it is quite practical to put suppressions for all tools into the same suppression file.
Next line: a small number of suppression types have extra
information after the second line (eg. the Param
suppression for Memcheck)
Remaining lines: This is the calling context for the error -- the chain of function calls that led to it. There can be up to 24 of these lines.
Locations may be names of either shared objects, functions,
or source lines. They begin with
obj:,
fun:, or
src: respectively. Function,
object, and file names to match against may use the wildcard characters
* and
?. Source lines are specified
using the form filename[:lineNumber].
Important note: C++ function names must be
mangled. If you are writing suppressions by
hand, use the --demangle=no option to get the
mangled names in your error messages. An example of a mangled
C++ name is _ZN9QListView4showEv.
This is the form that the GNU C++ compiler uses internally, and
the form that must be used in suppression files. The equivalent
demangled name, QListView::show(),
is what you see at the C++ source code level.
A location line may also be
simply "..." (three dots). This is
a frame-level wildcard, which matches zero or more frames. Frame
level wildcards are useful because they make it easy to ignore
varying numbers of uninteresting frames in between frames of
interest. That is often important when writing suppressions which
are intended to be robust against variations in the amount of
function inlining done by compilers.
Finally, the entire suppression must be between curly braces. Each brace must be the first character on its own line.
A suppression only suppresses an error when the error matches all the details in the suppression. Here's an example:
{
  __gconv_transform_ascii_internal/__mbrtowc/mbtowc
  Memcheck:Value4
  fun:__gconv_transform_ascii_internal
  fun:__mbr*toc
  fun:mbtowc
}
What it means is: for Memcheck only, suppress a
use-of-uninitialised-value error, when the data size is 4, when it
occurs in the function
__gconv_transform_ascii_internal, when
that is called from any function of name matching
__mbr*toc, when that is called from
mbtowc. It doesn't apply under any
other circumstances. The string by which this suppression is identified
to the user is
__gconv_transform_ascii_internal/__mbrtowc/mbtowc.
(See Writing suppression files for more details on the specifics of Memcheck's suppression kinds.)
Another example, again for the Memcheck tool:
{
  libX11.so.6.2/libX11.so.6.2/libXaw.so.7.0
  Memcheck:Value4
  obj:/usr/X11R6/lib/libX11.so.6.2
  obj:/usr/X11R6/lib/libX11.so.6.2
  obj:/usr/X11R6/lib/libXaw.so.7.0
}
This suppresses any size 4 uninitialised-value error which occurs
anywhere in libX11.so.6.2, when called from
anywhere in the same library, when called from anywhere in
libXaw.so.7.0. The inexact specification of
locations is regrettable, but is about all you can hope for, given that
the X11 libraries shipped on the Linux distro on which this example
was made have had their symbol tables removed.
An example of the src: specification, again for the Memcheck tool:
{
  libX11.so.6.2/libX11.so.6.2/libXaw.so.7.0
  Memcheck:Value4
  src:valid.c:321
}
This suppresses any size-4 uninitialised-value error which occurs
at line 321 in valid.c.
Although the above two examples do not make this clear, you can
freely mix obj:,
fun:, and
src:
lines in a suppression.
Finally, here's an example using three frame-level wildcards:
{
   a-contrived-example
   Memcheck:Leak
   fun:malloc
   ...
   fun:ddd
   ...
   fun:ccc
   ...
   fun:main
}
This suppresses Memcheck memory-leak errors, in the case where
the allocation was done by main
calling (though any number of intermediaries, including zero)
ccc,
calling onwards via
ddd and eventually
to malloc..
Valgrind supports the downloading of debuginfo files via debuginfod, an HTTP server for distributing ELF/DWARF debugging information. When a debuginfo file cannot be found locally, Valgrind is able to query debuginfod servers for the file using its build-id.
In order to use this feature
debuginfod-find must be installed and
$DEBUGINFOD_URLS must contain URLs of
debuginfod servers. Valgrind does not support
debuginfod-find verbose output that is
normally enabled with $DEBUGINFOD_PROGRESS
and $DEBUGINFOD_VERBOSE. These environment
variables will be ignored.
For more information regarding debuginfod, see https://sourceware.org/elfutils/Debuginfod.html
As mentioned above, Valgrind's core accepts a common set of options. The tools also accept tool-specific options, which are documented separately for each tool.
Valgrind's default settings succeed in giving reasonable behaviour in most cases. We group the available options by rough categories.
These options work with all tools.
-h --help
Show help for all options, both for the core and for the
selected tool. If the option is repeated it is equivalent to giving
--help-debug.
--help-debug
Same as --help, but also lists debugging
options which usually are only of use to Valgrind's
developers.
--version
Show the version number of the Valgrind core. Tools can have their own version numbers. There is a scheme in place to ensure that tools only execute when the core version is one they are known to work with. This was done to minimise the chances of strange problems arising from tool-vs-core version incompatibilities.
-q, --quiet
Run silently, and only print error messages. Useful if you are running regression tests or have some other automated test machinery.
-v, --verbose
Be more verbose. Gives extra information on various aspects of your program, such as: the shared objects loaded, the suppressions used, the progress of the instrumentation and execution engines, and warnings about unusual behaviour. Repeating the option increases the verbosity level.
--trace-children=<yes|no> [default: no]
When enabled, Valgrind will trace into sub-processes
initiated via the exec system call. This is
necessary for multi-process programs.
Note that Valgrind does trace into the child of a
fork (it would be difficult not to, since
fork makes an identical copy of a process), so this
option is arguably badly named. However, most children of
fork calls immediately call exec
anyway.
--trace-children-skip=patt1,patt2,...
This option only has an effect when
--trace-children=yes is specified. It allows
for some children to be skipped. The option takes a comma
separated list of patterns for the names of child executables
that Valgrind should not trace into. Patterns may include the
metacharacters ?
and *, which have the usual
meaning.
This can be useful for pruning uninteresting branches from a tree of processes being run on Valgrind. But you should be careful when using it. When Valgrind skips tracing into an executable, it doesn't just skip tracing that executable, it also skips tracing any of that executable's child processes. In other words, the flag doesn't merely cause tracing to stop at the specified executables -- it skips tracing of entire process subtrees rooted at any of the specified executables.
--trace-children-skip-by-arg=patt1,patt2,...
This is the same as
--trace-children-skip, with one difference:
the decision as to whether to trace into a child process is
made by examining the arguments to the child process, rather
than the name of its executable.
--child-silent-after-fork=<yes|no> [default: no]
When enabled, Valgrind will not show any debugging or
logging output for the child process resulting from
a fork call. This can make the output less
confusing (although more misleading) when dealing with processes
that create children. It is particularly useful in conjunction
with --trace-children=. Use of this option is also
strongly recommended if you are requesting XML output
(--xml=yes), since otherwise the XML from child and
parent may become mixed up, which usually makes it useless.
--vgdb=<no|yes|full> [default: yes]
Valgrind will provide "gdbserver" functionality when
--vgdb=yes or --vgdb=full is
specified. This allows an external GNU GDB debugger to control
and debug your program when it runs on Valgrind.
--vgdb=full incurs significant performance
overheads, but provides more precise breakpoints and
watchpoints. See Debugging your program using Valgrind's gdbserver and GDB for
a detailed description.
If the embedded gdbserver is enabled but no gdb is currently being used, the vgdb command line utility can send "monitor commands" to Valgrind from a shell. The Valgrind core provides a set of Valgrind monitor commands. A tool can optionally provide tool specific monitor commands, which are documented in the tool specific chapter.
--vgdb-error=<number> [default: 999999999]
Use this option when the Valgrind gdbserver is enabled with
--vgdb=yes or --vgdb=full.
Tools that report errors will wait
for "number" errors to be
reported before freezing the program and waiting for you to
connect with GDB. It follows that a value of zero will cause
the gdbserver to be started before your program is executed.
This is typically used to insert GDB breakpoints before
execution, and also works with tools that do not report
errors, such as Massif.
--vgdb-stop-at=<set> [default: none]
Use this option when the Valgrind gdbserver is enabled with
--vgdb=yes or --vgdb=full.
The Valgrind gdbserver will be invoked for each error after
--vgdb-error have been reported.
You can additionally ask the Valgrind gdbserver to be invoked
for other events, specified in one of the following ways:
a comma separated list of one or more of
startup exit valgrindabexit.
The values startup exit
valgrindabexit respectively indicate to
invoke gdbserver before your program is executed, after the
last instruction of your program, on Valgrind abnormal exit
(e.g. internal error, out of memory, ...).
Note: startup and
--vgdb-error=0 will both cause Valgrind
gdbserver to be invoked before your program is executed. The
--vgdb-error=0 will in addition cause your
program to stop on all subsequent errors.
all to specify the complete set.
It is equivalent to
--vgdb-stop-at=startup,exit,valgrindabexit.
none for the empty set.
--track-fds=<yes|no|all> [default: no]
When enabled, Valgrind will print out a list of open file
descriptors on exit or on request, via the gdbserver monitor
command v.info open_fds. Along with each
file descriptor is printed a stack backtrace of where the file
was opened and any details relating to the file descriptor such
as the file name or socket details. Use all to
include reporting on stdin,
stdout and
stderr.
--time-stamp=<yes|no> [default: no]
When enabled, each message is preceded with an indication of the elapsed wallclock time since startup, expressed as days, hours, minutes, seconds and milliseconds.
--log-fd=<number> [default: 2, stderr]
Specifies that Valgrind should send all of its messages to the specified file descriptor. The default, 2, is the standard error channel (stderr). Note that this may interfere with the client's own use of stderr, as Valgrind's output will be interleaved with any output that the client sends to stderr.
--log-file=<filename>
Specifies that Valgrind should send all of its messages to the specified file. If the file name is empty, it causes an abort. There are three special format specifiers that can be used in the file name.
%p is replaced with the current process ID.
This is very useful for program that invoke multiple processes.
WARNING: If you use --trace-children=yes and your
program invokes multiple processes OR your program forks without
calling exec afterwards, and you don't use this specifier
(or the %q specifier below), the Valgrind output from
all those processes will go into one file, possibly jumbled up, and
possibly incomplete. Note: If the program forks and calls exec afterwards,
Valgrind output of the child from the period between fork and exec
will be lost. Fortunately this gap is really tiny for most programs;
and modern programs use posix_spawn
anyway.
%n is replaced with a file sequence number
unique for this process.
This is useful for processes that produces several files
from the same filename template.
%q{FOO} is replaced with the contents of the
environment variable FOO. If the
{FOO} part is malformed, it causes an abort. This
specifier is rarely needed, but very useful in certain circumstances
(eg. when running MPI programs). The idea is that you specify a
variable which will be set differently for each process in the job,
for example BPROC_RANK or whatever is
applicable in your MPI setup. If the named environment variable is not
set, it causes an abort. Note that in some shells, the
{ and } characters may need to be
escaped with a backslash.
%% is replaced with %.
If an % is followed by any other character, it
causes an abort.
If the file name specifies a relative file name, it is put in the program's initial working directory: this is the current directory when the program started its execution after the fork or after the exec. If it specifies an absolute file name (ie. starts with '/') then it is put there.
--log-socket=<ip-address:port-number>
Specifies that Valgrind should send all of its messages to
the specified port at the specified IP address. The port may be
omitted, in which case port 1500 is used. If a connection cannot
be made to the specified socket, Valgrind falls back to writing
output to the standard error (stderr). This option is intended to
be used in conjunction with the
valgrind-listener program. For
further details, see
the commentary
in the manual.
These options are used by all tools that can report errors, e.g. Memcheck, but not Cachegrind.
--xml=<yes|no> [default: no]
When enabled, the important parts of the output (e.g. tool error
messages) will be in XML format rather than plain text. Furthermore,
the XML output will be sent to a different output channel than the
plain text output. Therefore, you also must use one of
--xml-fd, --xml-file or
--xml-socket to specify where the XML is to be sent.
Less important messages will still be printed in plain text, but
because the XML output and plain text output are sent to different
output channels (the destination of the plain text output is still
controlled by --log-fd, --log-file
and --log-socket) this should not cause problems.
This option is aimed at making life easier for tools that consume
Valgrind's output as input, such as GUI front ends. Currently this
option works with Memcheck, Helgrind and DRD. The output format is
specified in the file
docs/internals/xml-output-protocol4.txt
in the source tree for Valgrind 3.5.0 or later.
The recommended options for a GUI to pass, when requesting
XML output, are: --xml=yes to enable XML output,
--xml-file to send the XML output to a (presumably
GUI-selected) file, --log-file to send the plain
text output to a second GUI-selected file,
--child-silent-after-fork=yes, and
-q to restrict the plain text output to critical
error messages created by Valgrind itself. For example, failure to
read a specified suppressions file counts as a critical error message.
In this way, for a successful run the text output file will be empty.
But if it isn't empty, then it will contain important information
which the GUI user should be made aware
of.
--xml-fd=<number> [default: -1, disabled]
Specifies that Valgrind should send its XML output to the
specified file descriptor. It must be used in conjunction with
--xml=yes.
--xml-file=<filename>
Specifies that Valgrind should send its XML output
to the specified file. It must be used in conjunction with
--xml=yes. Any %p or
%q sequences appearing in the filename are expanded
in exactly the same way as they are for --log-file.
See the description of --log-file for details.
--xml-socket=<ip-address:port-number>
Specifies that Valgrind should send its XML output the
specified port at the specified IP address. It must be used in
conjunction with --xml=yes. The form of the argument
is the same as that used by --log-socket.
See the description of --log-socket
for further details.
--xml-user-comment=<string>
Embeds an extra user comment string at the start of the XML
output. Only works when --xml=yes is specified;
ignored otherwise.
--demangle=<yes|no> [default: yes]
Enable/disable automatic demangling (decoding) of C++ names. Enabled by default. When enabled, Valgrind will attempt to translate encoded C++ names back to something approaching the original. The demangler handles symbols mangled by g++ versions 2.X, 3.X and 4.X.
An important fact about demangling is that function names mentioned in suppressions files should be in their mangled form. Valgrind does not demangle function names when searching for applicable suppressions, because to do otherwise would make suppression file contents dependent on the state of Valgrind's demangling machinery, and also slow down suppression matching.
--num-callers=<number> [default: 12]
Specifies the maximum number of entries shown in stack traces that identify program locations. Note that errors are commoned up using only the top four function locations (the place in the current function, and that of its three immediate callers). So this doesn't affect the total number of errors reported.
The maximum value for this is 500. Note that higher settings will make Valgrind run a bit more slowly and take a bit more memory, but can be useful when working with programs with deeply-nested call chains.
--unw-stack-scan-thresh=<number> [default: 0]
,
--unw-stack-scan-frames=<number> [default: 5]
Stack-scanning support is available only on ARM targets.
These flags enable and control stack unwinding by stack scanning. When the normal stack unwinding mechanisms -- usage of Dwarf CFI records, and frame-pointer following -- fail, stack scanning may be able to recover a stack trace.
Note that stack scanning is an imprecise, heuristic mechanism that may give very misleading results, or none at all. It should be used only in emergencies, when normal unwinding fails, and it is important to nevertheless have stack traces.
Stack scanning is a simple technique: the unwinder reads words from the stack, and tries to guess which of them might be return addresses, by checking to see if they point just after ARM or Thumb call instructions. If so, the word is added to the backtrace.
The main danger occurs when a function call returns, leaving its return address exposed, and a new function is called, but the new function does not overwrite the old address. The result of this is that the backtrace may contain entries for functions which have already returned, and so be very confusing.
A second limitation of this implementation is that it will scan only the page (4KB, normally) containing the starting stack pointer. If the stack frames are large, this may result in only a few (or not even any) being present in the trace. Also, if you are unlucky and have an initial stack pointer near the end of its containing page, the scan may miss all interesting frames.
By default stack scanning is disabled. The normal use
case is to ask for it when a stack trace would otherwise be very
short. So, to enable it,
use --unw-stack-scan-thresh=number.
This requests Valgrind to try using stack scanning to "extend"
stack traces which contain fewer
than number frames.
If stack scanning does take place, it will only generate
at most the number of frames specified
by --unw-stack-scan-frames.
Typically, stack scanning generates so many garbage entries that
this value is set to a low value (5) by default. In no case
will a stack trace larger than the value specified
by --num-callers be
created.
--error-limit=<yes|no> [default: yes]
When enabled, Valgrind stops reporting errors after 10,000,000 in total, or 1,000 different ones, have been seen. This is to stop the error tracking machinery from becoming a huge performance overhead in programs with many errors.
--error-exitcode=<number> [default: 0]
Specifies an alternative exit code to return if Valgrind reported any errors in the run. When set to the default value (zero), the return value from Valgrind will always be the return value of the process being simulated. When set to a nonzero value, that value is returned instead, if Valgrind detects any errors. This is useful for using Valgrind as part of an automated test suite, since it makes it easy to detect test cases for which Valgrind has reported errors, just by inspecting return codes.
--exit-on-first-error=<yes|no> [default: no]
If this option is enabled, Valgrind exits on the first error.
A nonzero exit value must be defined using
--error-exitcode option.
Useful if you are running regression tests or have some other
automated test machinery.
--error-markers=<begin>,<end> [default: none]
When errors are output as plain text (i.e. XML not used),
--error-markers instructs to output a line
containing the begin (end)
string before (after) each error.
Such marker lines facilitate searching for errors and/or extracting errors in an output file that contain valgrind errors mixed with the program output.
Note that empty markers are accepted. So, only using a begin (or an end) marker is possible.
--show-error-list=no|yes [default: no]
If this option is enabled, for tools that report errors, valgrind will show the list of detected errors and the list of used suppressions at exit.
Note that at verbosity 2 and above, valgrind automatically shows
the list of detected errors and the list of used suppressions
at exit, unless --show-error-list=no is selected.
-s
Specifying -s is equivalent to
--show-error-list=yes.
--sigill-diagnostics=<yes|no> [default: yes]
Enable/disable printing of illegal instruction diagnostics.
Enabled by default, but defaults to disabled when
--quiet is given. The default can always be explicitly
overridden by giving this option.
When enabled, a warning message will be printed, along with some diagnostics, whenever an instruction is encountered that Valgrind cannot decode or translate, before the program is given a SIGILL signal. Often an illegal instruction indicates a bug in the program or missing support for the particular instruction in Valgrind. But some programs do deliberately try to execute an instruction that might be missing and trap the SIGILL signal to detect processor features. Using this flag makes it possible to avoid the diagnostic output that you would otherwise get in such cases.
--keep-debuginfo=<yes|no> [default: no]
When enabled, keep ("archive") symbols and all other debuginfo for unloaded code. This allows saved stack traces to include file/line info for code that has been dlclose'd (or similar). Be careful with this, since it can lead to unbounded memory use for programs which repeatedly load and unload shared objects.
Some tools and some functionalities have only limited support
for archived debug info. Memcheck fully supports it. Generally,
tools that report errors can use archived debug info to show the error
stack traces. The known limitations are: Helgrind's past access stack
trace of a race condition is does not use archived debug info. Massif
(and more generally the xtree Massif output format) does not make use
of archived debug info. Only Memcheck has been (somewhat) tested
with --keep-debuginfo=yes, so other tools may have
unknown limitations.
--show-below-main=<yes|no> [default: no]
By default, stack traces for errors do not show any
functions that appear beneath main because
most of the time it's uninteresting C library stuff and/or
gobbledygook. Alternatively, if main is not
present in the stack trace, stack traces will not show any functions
below main-like functions such as glibc's
__libc_start_main. Furthermore, if
main-like functions are present in the trace,
they are normalised as (below main), in order to
make the output more deterministic.
If this option is enabled, all stack trace entries will be
shown and main-like functions will not be
normalised.
--fullpath-after=<string>
              [default: don't show source paths]
By default Valgrind only shows the filenames in stack
traces, but not full paths to source files. When using Valgrind
in large projects where the sources reside in multiple different
directories, this can be inconvenient.
--fullpath-after provides a flexible solution
to this problem. When this option is present, the path to each
source file is shown, with the following all-important caveat:
if string is found in the path, then the path
up to and including string is omitted, else the
path is shown unmodified. Note that string is
not required to be a prefix of the path.
For example, consider a file named
/home/janedoe/blah/src/foo/bar/xyzzy.c.
Specifying --fullpath-after=/home/janedoe/blah/src/
will cause Valgrind to show the name
as foo/bar/xyzzy.c.
Because the string is not required to be a prefix,
--fullpath-after=src/ will produce the same
output. This is useful when the path contains arbitrary
machine-generated characters. For example, the
path
/my/build/dir/C32A1B47/blah/src/foo/xyzzy
can be pruned to foo/xyzzy
using
--fullpath-after=/blah/src/.
If you simply want to see the full path, just specify an
empty string: --fullpath-after=. This isn't a
special case, merely a logical consequence of the above rules.
Finally, you can use --fullpath-after
multiple times. Any appearance of it causes Valgrind to switch
to producing full paths and applying the above filtering rule.
Each produced path is compared against all
the --fullpath-after-specified strings, in the
order specified. The first string to match causes the path to
be truncated as described above. If none match, the full path
is shown. This facilitates chopping off prefixes when the
sources are drawn from a number of unrelated directories.
--extra-debuginfo-path=<path> [default: undefined and unused]
By default Valgrind searches in several well-known paths
for debug objects, such
as /usr/lib/debug/.
However, there may be scenarios where you may wish to put debug objects at an arbitrary location, such as external storage when running Valgrind on a mobile device with limited local storage. Another example might be a situation where you do not have permission to install debug object packages on the system where you are running Valgrind.
In these scenarios, you may provide an absolute path as an extra,
final place for Valgrind to search for debug objects by specifying
--extra-debuginfo-path=/path/to/debug/objects.
The given path will be prepended to the absolute path name of
the searched-for object. For example, if Valgrind is looking
for the debuginfo
for /w/x/y/zz.so
and --extra-debuginfo-path=/a/b/c is specified,
it will look for a debug object at
/a/b/c/w/x/y/zz.so.
This flag should only be specified once. If it is specified multiple times, only the last instance is honoured.
--debuginfo-server=ipaddr:port [default: undefined and unused]
This is a new, experimental, feature introduced in version 3.9.0.
In some scenarios it may be convenient to read debuginfo
from objects stored on a different machine. With this flag,
Valgrind will query a debuginfo server running
on ipaddr and listening on
port port, if it cannot find
the debuginfo object in the local filesystem.
The debuginfo server must accept TCP connections on
port port. The debuginfo
server is contained in the source
file auxprogs/valgrind-di-server.c.
It will only serve from the directory it is started
in. port defaults to 1500 in
both client and server if not specified.
If Valgrind looks for the debuginfo for
/w/x/y/zz.so by using the
debuginfo server, it will strip the pathname components and
merely request zz.so on the
server. That in turn will look only in its current working
directory for a matching debuginfo object.
The debuginfo data is transmitted in small fragments (8 KB) as requested by Valgrind. Each block is compressed using LZO to reduce transmission time. The implementation has been tuned for best performance over a single-stage 802.11g (WiFi) network link.
Note that checks for matching primary vs debug objects,
using GNU debuglink CRC scheme, are performed even when using
the debuginfo server. To disable such checking, you need to
also specify
--allow-mismatched-debuginfo=yes.
By default the Valgrind build system will
build valgrind-di-server for
the target platform, which is almost certainly not what you
want. So far we have been unable to find out how to get
automake/autoconf to build it for the build platform. If
you want to use it, you will have to recompile it by hand using
the command shown at the top
of auxprogs/valgrind-di-server.c.
Valgrind can also download debuginfo via debuginfod. See the DEBUGINFOD section for more information.
--allow-mismatched-debuginfo=no|yes [no]
When reading debuginfo from separate debuginfo objects, Valgrind will by default check that the main and debuginfo objects match, using the GNU debuglink mechanism. This guarantees that it does not read debuginfo from out of date debuginfo objects, and also ensures that Valgrind can't crash as a result of mismatches.
This check can be overridden using
--allow-mismatched-debuginfo=yes.
This may be useful when the debuginfo and main objects have not
been split in the proper way. Be careful when using this,
though: it disables all consistency checking, and Valgrind has
been observed to crash when the main and debuginfo objects don't
match.
--suppressions=<filename> [default: $PREFIX/lib/valgrind/default.supp]
Specifies an extra file from which to read descriptions of errors to suppress. You may use up to 100 extra suppression files.
--gen-suppressions=<yes|no|all> [default: no]
When set to yes, Valgrind will pause
after every error shown and print the line:
---- Print suppression ? --- [Return/N/n/Y/y/C/c] ----
Pressing Ret, or N Ret or
n Ret, causes Valgrind continue execution without
printing a suppression for this error.
Pressing Y Ret or
y Ret causes Valgrind to write a suppression
for this error. You can then cut and paste it into a suppression file
if you don't want to hear about the error in the future.
When set to all, Valgrind will print a
suppression for every reported error, without querying the
user.
This option is particularly useful with C++ programs, as it prints out the suppressions with mangled names, as required.
Note that the suppressions printed are as specific as possible. You may want to common up similar ones, by adding wildcards to function names, and by using frame-level wildcards. The wildcarding facilities are powerful yet flexible, and with a bit of careful editing, you may be able to suppress a whole family of related errors with only a few suppressions.
Sometimes two different errors
are suppressed by the same suppression, in which case Valgrind
will output the suppression more than once, but you only need to
have one copy in your suppression file (but having more than one
won't cause problems). Also, the suppression name is given as
<insert a suppression name
      here>
; the name doesn't really matter, it's
only used with the -v option which prints out all
used suppression records.
--input-fd=<number> [default: 0, stdin]
When using
--gen-suppressions=yes, Valgrind will stop so as
to read keyboard input from you when each error occurs. By
default it reads from the standard input (stdin), which is
problematic for programs which close stdin. This option allows
you to specify an alternative file descriptor from which to read
input.
--dsymutil=no|yes [yes]
This option is only relevant when running Valgrind on Mac OS X.
Mac OS X uses a deferred debug information (debuginfo)
linking scheme. When object files containing debuginfo are
linked into a .dylib or an
executable, the debuginfo is not copied into the final file.
Instead, the debuginfo must be linked manually by
running dsymutil, a
system-provided utility, on the executable
or .dylib. The resulting
combined debuginfo is placed in a directory alongside the
executable or .dylib, but with
the extension .dSYM.
With --dsymutil=no, Valgrind
will detect cases where the
.dSYM directory is either
missing, or is present but does not appear to match the
associated executable or .dylib,
most likely because it is out of date. In these cases, Valgrind
will print a warning message but take no further action.
With --dsymutil=yes, Valgrind
will, in such cases, automatically
run dsymutil as necessary to
bring the debuginfo up to date. For all practical purposes, if
you always use --dsymutil=yes, then
there is never any need to
run dsymutil manually or as part
of your applications's build system, since Valgrind will run it
as necessary.
Valgrind will not attempt to
run dsymutil on any
executable or library in
/usr/,
/bin/,
/sbin/,
/opt/,
/sw/,
/System/,
/Library/ or
/Applications/
since dsymutil will always fail
in such situations. It fails both because the debuginfo for
such pre-installed system components is not available anywhere,
and also because it would require write privileges in those
directories.
Be careful when
using --dsymutil=yes, since it will
cause pre-existing .dSYM
directories to be silently deleted and re-created. Also note that
dsymutil is quite slow, sometimes
excessively so.
--max-stackframe=<number> [default: 2000000]
The maximum size of a stack frame. If the stack pointer moves by more than this amount then Valgrind will assume that the program is switching to a different stack.
You may need to use this option if your program has large stack-allocated arrays. Valgrind keeps track of your program's stack pointer. If it changes by more than the threshold amount, Valgrind assumes your program is switching to a different stack, and Memcheck behaves differently than it would for a stack pointer change smaller than the threshold. Usually this heuristic works well. However, if your program allocates large structures on the stack, this heuristic will be fooled, and Memcheck will subsequently report large numbers of invalid stack accesses. This option allows you to change the threshold to a different value.
You should only consider use of this option if Valgrind's debug output directs you to do so. In that case it will tell you the new threshold you should specify.
In general, allocating large structures on the stack is a bad idea, because you can easily run out of stack space, especially on systems with limited memory or which expect to support large numbers of threads each with a small stack, and also because the error checking performed by Memcheck is more effective for heap-allocated data than for stack-allocated data. If you have to use this option, you may wish to consider rewriting your code to allocate on the heap rather than on the stack.
--main-stacksize=<number>
               [default: use current 'ulimit' value]
Specifies the size of the main thread's stack.
To simplify its memory management, Valgrind reserves all required space for the main thread's stack at startup. That means it needs to know the required stack size at startup.
By default, Valgrind uses the current "ulimit" value for the stack size, or 16 MB, whichever is lower. In many cases this gives a stack size in the range 8 to 16 MB, which almost never overflows for most applications.
If you need a larger total stack size,
use --main-stacksize to specify it. Only set
it as high as you need, since reserving far more space than you
need (that is, hundreds of megabytes more than you need)
constrains Valgrind's memory allocators and may reduce the total
amount of memory that Valgrind can use. This is only really of
significance on 32-bit machines.
On Linux, you may request a stack of size up to 2GB. Valgrind will stop with a diagnostic message if the stack cannot be allocated.
--main-stacksize only affects the stack
size for the program's initial thread. It has no bearing on the
size of thread stacks, as Valgrind does not allocate
those.
You may need to use both --main-stacksize
and --max-stackframe together. It is important
to understand that --main-stacksize sets the
maximum total stack size,
whilst --max-stackframe specifies the largest
size of any one stack frame. You will have to work out
the --main-stacksize value for yourself
(usually, if your applications segfaults). But Valgrind will
tell you the needed --max-stackframe size, if
necessary.
As discussed further in the description
of --max-stackframe, a requirement for a large
stack is a sign of potential portability problems. You are best
advised to place all large data in heap-allocated memory.
--max-threads=<number> [default: 500]
By default, Valgrind can handle to up to 500 threads.
Occasionally, that number is too small. Use this option to
provide a different limit. E.g.
--max-threads=3000.
For tools that use their own version of
malloc (e.g. Memcheck,
Massif, Helgrind, DRD), the following options apply.
--alignment=<number> [default: 8 or 16, depending on the platform]
By default Valgrind's malloc,
realloc, etc, return a block whose starting
address is 8-byte aligned or 16-byte aligned (the value depends on the
platform and matches the platform default). This option allows you to
specify a different alignment. The supplied value must be greater
than or equal to the default, less than or equal to 4096, and must be
a power of two.
--redzone-size=<number> [default: depends on the tool]
Valgrind's malloc, realloc, etc, add
padding blocks before and after each heap block allocated by the
program being run. Such padding blocks are called redzones. The
default value for the redzone size depends on the tool. For
example, Memcheck adds and protects a minimum of 16 bytes before
and after each block allocated by the client. This allows it to
detect block underruns or overruns of up to 16 bytes.
Increasing the redzone size makes it possible to detect overruns of larger distances, but increases the amount of memory used by Valgrind. Decreasing the redzone size will reduce the memory needed by Valgrind but also reduces the chances of detecting over/underruns, so is not recommended.
--xtree-memory=none|allocs|full [none]
Tools replacing Valgrind's malloc,
realloc, etc, can optionally produce an execution
tree detailing which piece of code is responsible for heap
memory usage. See Execution Trees
for a detailed explanation about execution trees.
When set to none, no memory execution
tree is produced.
When set to allocs, the memory
execution tree gives the current number of allocated bytes and
the current number of allocated blocks.
When set to full, the memory execution
tree gives 6 different measurements : the current number of
allocated bytes and blocks (same values as
for allocs), the total number of allocated
bytes and blocks, the total number of freed bytes and
blocks.
Note that the overhead in cpu and memory to produce
an xtree depends on the tool. The overhead in cpu is small for
the value allocs, as the information needed
to produce this report is maintained in any case by the tool.
For massif and helgrind, specifying full
implies to capture a stack trace for each free operation,
while normally these tools only capture an allocation stack
trace. For Memcheck, the cpu overhead for the
value full is small, as this can only be
used in combination with
--keep-stacktraces=alloc-and-free or
--keep-stacktraces=alloc-then-free, which
already records a stack trace for each free operation. The
memory overhead varies between 5 and 10 words per unique
stacktrace in the xtree, plus the memory needed to record the
stack trace for the free operations, if needed specifically
for the xtree.
--xtree-memory-file=<filename> [default:
      xtmemory.kcg.%p]
Specifies that Valgrind should produce the xtree memory
report in the specified file. Any %p or
%q sequences appearing in the filename are expanded
in exactly the same way as they are for --log-file.
See the description of --log-file
for details.
If the filename contains the extension .ms,
then the produced file format will be a massif output file format.
If the filename contains the extension .kcg
or no extension is provided or recognised,
then the produced file format will be a callgrind output format.
See Execution Trees for a detailed explanation about execution trees formats.
These options apply to all tools, as they affect certain obscure workings of the Valgrind core. Most people won't need to use them.
--smc-check=<none|stack|all|all-non-file>
      [default: all-non-file for x86/amd64/s390x, stack for other archs]
This option controls Valgrind's detection of self-modifying code. If no checking is done, when a program executes some code, then overwrites it with new code, and executes the new code, Valgrind will continue to execute the translations it made for the old code. This will likely lead to incorrect behaviour and/or crashes.
For "modern" architectures -- anything that's not x86,
amd64 or s390x -- the default is stack.
This is because a correct program must take explicit action
to reestablish D-I cache coherence following code
modification. Valgrind observes and honours such actions,
with the result that self-modifying code is transparently
handled with zero extra cost.
For x86, amd64 and s390x, the program is not required to
notify the hardware of required D-I coherence syncing. Hence
the default is all-non-file, which covers
the normal case of generating code into an anonymous
(non-file-backed) mmap'd area.
The meanings of the four available settings are as
follows. No detection (none),
detect self-modifying code
on the stack (which is used by GCC to implement nested
functions) (stack), detect self-modifying code
everywhere (all), and detect
self-modifying code everywhere except in file-backed
mappings (all-non-file).
Running with all will slow Valgrind
down noticeably. Running with none will
rarely speed things up, since very little code gets
dynamically generated in most programs. The
VALGRIND_DISCARD_TRANSLATIONS client
request is an alternative to --smc-check=all
and --smc-check=all-non-file
that requires more programmer effort but allows Valgrind to run
your program faster, by telling it precisely when translations
need to be re-made.
--smc-check=all-non-file provides a
cheaper but more limited version
of --smc-check=all. It adds checks to any
translations that do not originate from file-backed memory
mappings. Typical applications that generate code, for example
JITs in web browsers, generate code into anonymous mmaped areas,
whereas the "fixed" code of the browser always lives in
file-backed mappings. --smc-check=all-non-file
takes advantage of this observation, limiting the overhead of
checking to code which is likely to be JIT generated.
--read-inline-info=<yes|no> [default: see below]
When enabled, Valgrind will read information about inlined
function calls from DWARF3 debug info. This slows Valgrind
startup and makes it use more memory (typically for each inlined
piece of code, 6 words and space for the function name), but it
results in more descriptive stacktraces. Currently,
this functionality is enabled by default only for Linux,
Android and Solaris targets and only for the tools Memcheck, Massif,
Helgrind and DRD. Here is an example of some stacktraces with
--read-inline-info=no:
==15380== Conditional jump or move depends on uninitialised value(s)
==15380==    at 0x80484EA: main (inlinfo.c:6)
==15380==
==15380== Conditional jump or move depends on uninitialised value(s)
==15380==    at 0x8048550: fun_noninline (inlinfo.c:6)
==15380==    by 0x804850E: main (inlinfo.c:34)
==15380==
==15380== Conditional jump or move depends on uninitialised value(s)
==15380==    at 0x8048520: main (inlinfo.c:6)
And here are the same errors with
--read-inline-info=yes:
==15377== Conditional jump or move depends on uninitialised value(s)
==15377==    at 0x80484EA: fun_d (inlinfo.c:6)
==15377==    by 0x80484EA: fun_c (inlinfo.c:14)
==15377==    by 0x80484EA: fun_b (inlinfo.c:20)
==15377==    by 0x80484EA: fun_a (inlinfo.c:26)
==15377==    by 0x80484EA: main (inlinfo.c:33)
==15377==
==15377== Conditional jump or move depends on uninitialised value(s)
==15377==    at 0x8048550: fun_d (inlinfo.c:6)
==15377==    by 0x8048550: fun_noninline (inlinfo.c:41)
==15377==    by 0x804850E: main (inlinfo.c:34)
==15377==
==15377== Conditional jump or move depends on uninitialised value(s)
==15377==    at 0x8048520: fun_d (inlinfo.c:6)
==15377==    by 0x8048520: main (inlinfo.c:35)
--read-var-info=<yes|no> [default: no]
When enabled, Valgrind will read information about variable types and locations from DWARF3 debug info. This slows Valgrind startup significantly and makes it use significantly more memory, but for the tools that can take advantage of it (Memcheck, Helgrind, DRD) it can result in more precise error messages. For example, here are some standard errors issued by Memcheck:
==15363== Uninitialised byte(s) found during client check request
==15363==    at 0x80484A9: croak (varinfo1.c:28)
==15363==    by 0x8048544: main (varinfo1.c:55)
==15363==  Address 0x80497f7 is 7 bytes inside data symbol "global_i2"
==15363==
==15363== Uninitialised byte(s) found during client check request
==15363==    at 0x80484A9: croak (varinfo1.c:28)
==15363==    by 0x8048550: main (varinfo1.c:56)
==15363==  Address 0xbea0d0cc is on thread 1's stack
==15363==  in frame #1, created by main (varinfo1.c:45)
And here are the same errors with
--read-var-info=yes:
==15370== Uninitialised byte(s) found during client check request
==15370==    at 0x80484A9: croak (varinfo1.c:28)
==15370==    by 0x8048544: main (varinfo1.c:55)
==15370==  Location 0x80497f7 is 0 bytes inside global_i2[7],
==15370==  a global variable declared at varinfo1.c:41
==15370==
==15370== Uninitialised byte(s) found during client check request
==15370==    at 0x80484A9: croak (varinfo1.c:28)
==15370==    by 0x8048550: main (varinfo1.c:56)
==15370==  Location 0xbeb4a0cc is 0 bytes inside local var "local"
==15370==  declared at varinfo1.c:46, in frame #1 of thread 1
--vgdb-poll=<number> [default: 5000]
As part of its main loop, the Valgrind scheduler will poll to check if some activity (such as an external command or some input from a gdb) has to be handled by gdbserver. This activity poll will be done after having run the given number of basic blocks (or slightly more than the given number of basic blocks). This poll is quite cheap so the default value is set relatively low. You might further decrease this value if vgdb cannot use ptrace system call to interrupt Valgrind if all threads are (most of the time) blocked in a system call.
--vgdb-shadow-registers=no|yes [default: no]
When activated, gdbserver will expose the Valgrind shadow registers to GDB. With this, the value of the Valgrind shadow registers can be examined or changed using GDB. Exposing shadow registers only works with GDB version 7.1 or later.
--vgdb-prefix=<prefix> [default: /tmp/vgdb-pipe]
To communicate with gdb/vgdb, the Valgrind gdbserver creates 3 files (2 named FIFOs and a mmap shared memory file). The prefix option controls the directory and prefix for the creation of these files.
--run-libc-freeres=<yes|no> [default: yes]
This option is only relevant when running Valgrind on Linux.
The GNU C library (libc.so), which is
used by all programs, may allocate memory for its own uses.
Usually it doesn't bother to free that memory when the program
ends—there would be no point, since the Linux kernel reclaims
all process resources when a process exits anyway, so it would
just slow things down.
The glibc authors realised that this behaviour causes leak
checkers, such as Valgrind, to falsely report leaks in glibc, when
a leak check is done at exit. In order to avoid this, they
provided a routine called __libc_freeres
specifically to make glibc release all memory it has allocated.
Memcheck therefore tries to run
__libc_freeres at exit.
Unfortunately, in some very old versions of glibc,
__libc_freeres is sufficiently buggy to cause
segmentation faults. This was particularly noticeable on Red Hat
7.1. So this option is provided in order to inhibit the run of
__libc_freeres. If your program seems to run
fine on Valgrind, but segfaults at exit, you may find that
--run-libc-freeres=no fixes that, although at the
cost of possibly falsely reporting space leaks in
libc.so.
--run-cxx-freeres=<yes|no> [default: yes]
This option is only relevant when running Valgrind on Linux or Solaris C++ programs.
The GNU Standard C++ library (libstdc++.so),
which is used by all C++ programs compiled with g++, may allocate memory
for its own uses. Usually it doesn't bother to free that memory when
the program ends—there would be no point, since the kernel reclaims
all process resources when a process exits anyway, so it would
just slow things down.
The gcc authors realised that this behaviour causes leak
checkers, such as Valgrind, to falsely report leaks in libstdc++, when
a leak check is done at exit. In order to avoid this, they
provided a routine called __gnu_cxx::__freeres
specifically to make libstdc++ release all memory it has allocated.
Memcheck therefore tries to run
__gnu_cxx::__freeres at exit.
For the sake of flexibility and unforeseen problems with
__gnu_cxx::__freeres, option
--run-cxx-freeres=no exists,
although at the cost of possibly falsely reporting space leaks in
libstdc++.so.
--sim-hints=hint1,hint2,...
Pass miscellaneous hints to Valgrind which slightly modify the simulated behaviour in nonstandard or dangerous ways, possibly to help the simulation of strange features. By default no hints are enabled. Use with caution! Currently known hints are:
lax-ioctls: Be very lax about ioctl
handling; the only assumption is that the size is
correct. Doesn't require the full buffer to be initialised
when writing. Without this, using some device drivers with a
large number of strange ioctl commands becomes very
tiresome.
fuse-compatible: Enable special
handling for certain system calls that may block in a FUSE
file-system. This may be necessary when running Valgrind
on a multi-threaded program that uses one thread to manage
a FUSE file-system and another thread to access that
file-system.
enable-outer: Enable some special
magic needed when the program being run is itself
Valgrind.
no-inner-prefix: Disable printing
a prefix > in front of each stdout or
stderr output line in an inner Valgrind being run by an
outer Valgrind. This is useful when running Valgrind
regression tests in an outer/inner setup. Note that the
prefix > will always be printed in
front of the inner debug logging lines.
no-nptl-pthread-stackcache:
This hint is only relevant when running Valgrind on Linux;
it is ignored on Solaris and Mac OS X.
The GNU glibc pthread library
(libpthread.so), which is used by
pthread programs, maintains a cache of pthread stacks.
When a pthread terminates, the memory used for the pthread
stack and some thread local storage related data structure
are not always directly released. This memory is kept in
a cache (up to a certain size), and is re-used if a new
thread is started.
This cache causes the helgrind tool to report some
false positive race condition errors on this cached
memory, as helgrind does not understand the internal glibc
cache synchronisation primitives. So, when using helgrind,
disabling the cache helps to avoid false positive race
conditions, in particular when using thread local storage
variables (e.g. variables using the
__thread qualifier).
When using the memcheck tool, disabling the cache ensures the memory used by glibc to handle __thread variables is directly released when a thread terminates.
Note: Valgrind disables the cache using some internal knowledge of the glibc stack cache implementation and by examining the debug information of the pthread library. This technique is thus somewhat fragile and might not work for all glibc versions. This has been successfully tested with various glibc versions (e.g. 2.11, 2.16, 2.18) on various platforms.
lax-doors: (Solaris only) Be very lax
about door syscall handling over unrecognised door file
descriptors. Does not require that full buffer is initialised
when writing. Without this, programs using libdoor(3LIB)
functionality with completely proprietary semantics may report
large number of false positives.
fallback-llsc: (MIPS and ARM64 only): Enables
an alternative implementation of Load-Linked (LL) and
Store-Conditional (SC) instructions. The standard implementation
gives more correct behaviour, but can cause indefinite looping on
certain processor implementations that are intolerant of extra
memory references between LL and SC. So far this is known only to
happen on Cavium 3 cores.
You should not need to use this flag, since the relevant cores are
detected at startup and the alternative implementation is
automatically enabled if necessary. There is no equivalent
anti-flag: you cannot force-disable the alternative
implementation, if it is automatically enabled.
The underlying problem exists because the "standard"
implementation of LL and SC is done by copying through LL and SC
instructions into the instrumented code. However, tools may
insert extra instrumentation memory references in between the LL
and SC instructions. These memory references are not present in
the original uninstrumented code, and their presence in the
instrumented code can cause the SC instructions to persistently
fail, leading to indefinite looping in LL-SC blocks.
The alternative implementation gives correct behaviour of LL and
SC instructions between threads in a process, up to and including
the ABA scenario. It also gives correct behaviour between a
Valgrinded thread and a non-Valgrinded thread running in a
different process, that communicate via shared memory, but only up
to and including correct CAS behaviour -- in this case the ABA
scenario may not be correctly handled.
--fair-sched=<no|yes|try> [default: no]
The --fair-sched option controls
the locking mechanism used by Valgrind to serialise thread
execution. The locking mechanism controls the way the threads
are scheduled, and different settings give different trade-offs
between fairness and performance. For more details about the
Valgrind thread serialisation scheme and its impact on
performance and thread scheduling, see
Scheduling and Multi-Thread Performance.
The value --fair-sched=yes
activates a fair scheduler. In short, if multiple threads are
ready to run, the threads will be scheduled in a round robin
fashion. This mechanism is not available on all platforms or
Linux versions. If not available,
using --fair-sched=yes will cause Valgrind to
terminate with an error.
You may find this setting improves overall responsiveness if you are running an interactive multithreaded program, for example a web browser, on Valgrind.
The value --fair-sched=try
activates fair scheduling if available on the
platform. Otherwise, it will automatically fall back
to --fair-sched=no.
The value --fair-sched=no activates
a scheduler which does not guarantee fairness
between threads ready to run, but which in general gives the
highest performance.
--kernel-variant=variant1,variant2,...
Handle system calls and ioctls arising from minor variants of the default kernel for this platform. This is useful for running on hacked kernels or with kernel modules which support nonstandard ioctls, for example. Use with caution. If you don't understand what this option does then you almost certainly don't need it. Currently known variants are:
bproc: support the
sys_broc system call on x86. This is for
running on BProc, which is a minor variant of standard Linux which
is sometimes used for building clusters.
android-no-hw-tls: some
versions of the Android emulator for ARM do not provide a
hardware TLS (thread-local state) register, and Valgrind
crashes at startup. Use this variant to select software
support for TLS.
android-gpu-sgx5xx: use this to
support handling of proprietary ioctls for the PowerVR SGX
5XX series of GPUs on Android devices. Failure to select
this does not cause stability problems, but may cause
Memcheck to report false errors after the program performs
GPU-specific ioctls.
android-gpu-adreno3xx: similarly, use
this to support handling of proprietary ioctls for the
Qualcomm Adreno 3XX series of GPUs on Android devices.
--merge-recursive-frames=<number> [default: 0]
Some recursive algorithms, for example balanced binary tree implementations, create many different stack traces, each containing cycles of calls. A cycle is defined as two identical program counter values separated by zero or more other program counter values. Valgrind may then use a lot of memory to store all these stack traces. This is a poor use of memory considering that such stack traces contain repeated uninteresting recursive calls instead of more interesting information such as the function that has initiated the recursive call.
The option --merge-recursive-frames=<number>
instructs Valgrind to detect and merge recursive call cycles
having a size of up to <number>
frames. When such a cycle is detected, Valgrind records the
cycle in the stack trace as a unique program counter.
The value 0 (the default) causes no recursive call merging. A value of 1 will cause stack traces of simple recursive algorithms (for example, a factorial implementation) to be collapsed. A value of 2 will usually be needed to collapse stack traces produced by recursive algorithms such as binary trees, quick sort, etc. Higher values might be needed for more complex recursive algorithms.
Note: recursive calls are detected by analysis of program counter values. They are not detected by looking at function names.
--num-transtab-sectors=<number> [default: 6
      for Android platforms, 16 for all others]
Valgrind translates and instruments your program's machine
code in small fragments (basic blocks). The translations are stored in a
translation cache that is divided into a number of sections
(sectors). If the cache is full, the sector containing the
oldest translations is emptied and reused. If these old
translations are needed again, Valgrind must re-translate and
re-instrument the corresponding machine code, which is
expensive. If the "executed instructions" working set of a
program is big, increasing the number of sectors may improve
performance by reducing the number of re-translations needed.
Sectors are allocated on demand. Once allocated, a sector can
never be freed, and occupies considerable space, depending on the tool
and the value of --avg-transtab-entry-size
(about 40 MB per sector for Memcheck). Use the
option --stats=yes to obtain precise
information about the memory used by a sector and the allocation
and recycling of sectors.
--avg-transtab-entry-size=<number> [default: 0,
      meaning use tool provided default]
Average size of translated basic block. This average size
is used to dimension the size of a sector.
Each tool provides a default value to be used.
If this default value is too small, the translation sectors
will become full too quickly. If this default value is too big,
a significant part of the translation sector memory will be unused.
Note that the average size of a basic block translation depends
on the tool, and might depend on tool options. For example,
the memcheck option --track-origins=yes
increases the size of the basic block translations.
Use --avg-transtab-entry-size to tune the size of the
sectors, either to gain memory or to avoid too many retranslations.
--aspace-minaddr=<address> [default: depends
      on the platform]
To avoid potential conflicts with some system libraries,
Valgrind does not use the address space
below --aspace-minaddr value, keeping it
reserved in case a library specifically requests memory in this
region. So, some "pessimistic" value is guessed by Valgrind
depending on the platform. On linux, by default, Valgrind avoids
using the first 64MB even if typically there is no conflict in
this complete zone. You can use the
option --aspace-minaddr to have your memory
hungry application benefitting from more of this lower memory.
On the other hand, if you encounter a conflict, increasing
aspace-minaddr value might solve it. Conflicts will typically
manifest themselves with mmap failures in the low range of the
address space. The
provided address must be page
aligned and must be equal or bigger to 0x1000 (4KB). To find the
default value on your platform, do something such as
valgrind -d -d date 2>&1 | grep -i minaddr.
Values lower than 0x10000 (64KB) are known to create problems
on some distributions.
--valgrind-stacksize=<number> [default: 1MB]
For each thread, Valgrind needs its own 'private' stack. The default size for these stacks is largely dimensioned, and so should be sufficient in most cases. In case the size is too small, Valgrind will segfault. Before segfaulting, a warning might be produced by Valgrind when approaching the limit.
Use the option --valgrind-stacksize if such an (unlikely)
warning is produced, or Valgrind dies due to a segmentation violation.
Such segmentation violations have been seen when demangling huge C++
symbols.
If your application uses many threads and needs a lot of memory, you can
gain some memory by reducing the size of these Valgrind stacks using
the option --valgrind-stacksize.
--show-emwarns=<yes|no> [default: no]
When enabled, Valgrind will emit warnings about its CPU emulation in certain cases. These are usually not interesting.
--require-text-symbol=:sonamepatt:fnnamepatt
When a shared object whose soname
matches sonamepatt is loaded into the
process, examine all the text symbols it exports. If none of
those match fnnamepatt, print an error
message and abandon the run. This makes it possible to ensure
that the run does not continue unless a given shared object
contains a particular function name.
Both sonamepatt and
fnnamepatt can be written using the usual
? and * wildcards. For
example: ":*libc.so*:foo?bar". You may use
characters other than a colon to separate the two patterns. It
is only important that the first character and the separator
character are the same. For example, the above example could
also be written "Q*libc.so*Qfoo?bar".
Multiple --require-text-symbol flags are
allowed, in which case shared objects that are loaded into
the process will be checked against all of them.
The purpose of this is to support reliable usage of marked-up
libraries. For example, suppose we have a version of GCC's
libgomp.so which has been marked up with
annotations to support Helgrind. It is only too easy and
confusing to load the wrong, un-annotated
libgomp.so into the application. So the idea
is: add a text symbol in the marked-up library, for
example annotated_for_helgrind_3_6, and then
give the flag
--require-text-symbol=:*libgomp*so*:annotated_for_helgrind_3_6
so that when libgomp.so is loaded, Valgrind
scans its symbol table, and if the symbol isn't present the run
is aborted, rather than continuing silently with the
un-marked-up library. Note that you should put the entire flag
in quotes to stop shells expanding up the *
and ? wildcards.
--soname-synonyms=syn1=pattern1,syn2=pattern2,...
When a shared library is loaded, Valgrind checks for
functions in the library that must be replaced or wrapped. For
example, Memcheck replaces some string and memory functions
(strchr, strlen, strcpy, memchr, memcpy, memmove, etc.) with its
own versions. Such replacements are normally done only in shared
libraries whose soname matches a predefined soname pattern (e.g.
libc.so* on linux). By default, no
replacement is done for a statically linked binary or for
alternative libraries, except for the allocation functions
(malloc, free, calloc, memalign, realloc, operator new, operator
delete, etc.) Such allocation functions are intercepted by
default in any shared library or in the executable if they are
exported as global symbols. This means that if a replacement
allocation library such as tcmalloc is found, its functions are
also intercepted by default.
In some cases, the replacements allow
--soname-synonyms to specify one additional
synonym pattern, giving flexibility in the replacement. Or to
prevent interception of all public allocation symbols.
Currently, this flexibility is only allowed for the
malloc related functions, using the
synonym somalloc. This synonym is usable for
all tools doing standard replacement of malloc related functions
(e.g. memcheck, helgrind, drd, massif, dhat).
Alternate malloc library: to replace the malloc
related functions in a specific alternate library with
soname mymalloclib.so (and not in any
others), give the
option --soname-synonyms=somalloc=mymalloclib.so.
A pattern can be used to match multiple libraries sonames.
For
example, --soname-synonyms=somalloc=*tcmalloc*
will match the soname of all variants of the tcmalloc
library (native, debug, profiled, ... tcmalloc
variants).
Note: the soname of a elf shared library can be retrieved using the readelf utility.
Replacements in a statically linked library are done
by using the NONE pattern. For example,
if you link with libtcmalloc.a, and only
want to intercept the malloc related functions in the
executable (and standard libraries) themselves, but not any
other shared libraries, you can give the
option --soname-synonyms=somalloc=NONE.
Note that a NONE pattern will match the main executable and
any shared library having no soname.
To run a "default" Firefox build for Linux, in which
JEMalloc is linked in to the main executable,
use --soname-synonyms=somalloc=NONE.
To only intercept allocation symbols in the default
system libraries, but not in any other shared library or the
executable defining public malloc or operator new related
functions use a non-existing library name
like --soname-synonyms=somalloc=nouserintercepts
(where nouserintercepts can be any
non-existing library name).
Shared library of the dynamic (runtime) linker is excluded from
searching for global public symbols, such as those for the malloc
related functions (identified by somalloc synonym).
--progress-interval=<number> [default: 0, meaning 'disabled']
This is an enhancement to Valgrind's debugging output. It is unlikely to be of interest to end users.
When number is set to a non-zero value,
Valgrind will print a one-line progress summary
every number seconds. Valid settings
for number are between 0 and 3600
inclusive. Here's some example output
with number
set to 10:
PROGRESS: U 110s, W 113s, 97.3% CPU, EvC 414.79M, TIn 616.7k, TOut 0.5k, #thr 67
PROGRESS: U 120s, W 124s, 96.8% CPU, EvC 505.27M, TIn 636.6k, TOut 3.0k, #thr 64
PROGRESS: U 130s, W 134s, 97.0% CPU, EvC 574.90M, TIn 657.5k, TOut 3.0k, #thr 63
Each line shows:
U: total user time
W: total wallclock time
CPU: overall average cpu use
EvC: number of event checks. An event
check is a backwards branch in the simulated program, so this is a
measure of forward progress of the program
TIn: number of code blocks instrumented
by the JIT
TOut: number of instrumented code
blocks that have been thrown away
#thr: number of threads in the
program
From the progress of these, it is possible to observe:
when the program is compute bound (TIn
rises slowly, EvC rises rapidly)
when the program is in a spinloop
(TIn/TOut
fixed, EvC rises rapidly)
when the program is JIT-bound (TIn
rises rapidly)
when the program is rapidly discarding code
(TOut rises rapidly)
when the program is about to achieve some expected state
(EvC arrives at some value you
expect)
when the program is idling (U rises
more slowly than W)
There are also some options for debugging
Valgrind itself. You shouldn't need to use them in the normal run of
things. If you wish to see the list, use the
--help-debug option.
If you wish to debug your program rather than debugging
Valgrind itself, then you should use the options
--vgdb=yes or --vgdb=full.
Note that Valgrind also reads options from three places:
The file ~/.valgrindrc
The environment variable
$VALGRIND_OPTS
The file ./.valgrindrc
These are processed in the given order, before the
command-line options. Options processed later override those
processed earlier; for example, options in
./.valgrindrc will take
precedence over those in
~/.valgrindrc.
Please note that the ./.valgrindrc
file is ignored if it is not a regular file, or is marked as world writeable,
or is not owned by the current user. This is because the
./.valgrindrc can contain options that are
potentially harmful or can be used by a local attacker to execute code under
your user account.
Any tool-specific options put in
$VALGRIND_OPTS or the
.valgrindrc files should be
prefixed with the tool name and a colon. For example, if you
want Memcheck to always do leak checking, you can put the
following entry in ~/.valgrindrc:
--memcheck:leak-check=yes
This will be ignored if any tool other than Memcheck is
run. Without the memcheck:
part, this will cause problems if you select other tools that
don't understand
--leak-check=yes.
The value of some command line options can be changed dynamically while your program is running under Valgrind.
The dynamically changeable options of the valgrind core and a given
tool can be listed using option
--help-dyn-options, for example:
$ valgrind --tool=memcheck --help-dyn-options
  dynamically changeable options:
    -v -q -d --stats --vgdb=no --vgdb=yes --vgdb=full --vgdb-poll --vgdb-error
    --vgdb-stop-at --error-markers --show-error-list -s --show-below-main
    --time-stamp --trace-children --child-silent-after-fork --trace-sched
    --trace-signals --trace-symtab --trace-cfi --debug-dump=syms
    --debug-dump=line --debug-dump=frames --trace-redir --trace-syscalls
    --sym-offsets --progress-interval --merge-recursive-frames
    --vex-iropt-verbosity --suppressions --trace-flags --trace-notbelow
    --trace-notabove --profile-flags --gen-suppressions=no
    --gen-suppressions=yes --gen-suppressions=all --errors-for-leak-kinds
    --show-leak-kinds --leak-check-heuristics --show-reachable
    --show-possibly-lost --freelist-vol --freelist-big-blocks --leak-check=no
    --leak-check=summary --leak-check=yes --leak-check=full --ignore-ranges
    --ignore-range-below-sp --show-mismatched-frees
valgrind: Use --help for more information.
$
The dynamic options can be changed the following ways:
From the shell, using vgdb and the monitor command
v.clo:
$ vgdb "v.clo --trace-children=yes --child-silent-after-fork=no"
sending command v.clo --trace-children=yes --child-silent-after-fork=no to pid 4404
$
Note: you must use double quotes around the monitor command to avoid vgdb interpreting the valgrind options as its own options.
From gdb, using the the monitor command
v.clo:
(gdb) monitor v.clo --trace-children=yes --child-silent-after-fork=no
(gdb)
From your program, using the client request
VALGRIND_CLO_CHANGE(option):
      VALGRIND_CLO_CHANGE ("--trace-children=yes");
      VALGRIND_CLO_CHANGE ("--child-silent-after-fork=no");
Dynamically changeable options can be used in various circumstances, such as changing the valgrind behaviour during execution, loading suppression files as part of shared library initialisation, change or set valgrind options in child processes, ...
Threaded programs are fully supported.
The main thing to point out with respect to threaded programs is that your program will use the native threading library, but Valgrind serialises execution so that only one (kernel) thread is running at a time. This approach avoids the horrible implementation problems of implementing a truly multithreaded version of Valgrind, but it does mean that threaded apps never use more than one CPU simultaneously, even if you have a multiprocessor or multicore machine.
Valgrind doesn't schedule the threads itself. It merely ensures that only one thread runs at once, using a simple locking scheme. The actual thread scheduling remains under control of the OS kernel. What this does mean, though, is that your program will see very different scheduling when run on Valgrind than it does when running normally. This is both because Valgrind is serialising the threads, and because the code runs so much slower than normal.
This difference in scheduling may cause your program to behave differently, if you have some kind of concurrency, critical race, locking, or similar, bugs. In that case you might consider using the tools Helgrind and/or DRD to track them down.
On Linux, Valgrind also supports direct use of the
clone system call,
futex and so on.
clone is supported where either
everything is shared (a thread) or nothing is shared (fork-like); partial
sharing will fail.
A thread executes code only when it holds the abovementioned lock. After executing some number of instructions, the running thread will release the lock. All threads ready to run will then compete to acquire the lock.
The --fair-sched option controls the locking mechanism
used to serialise thread execution.
The default pipe based locking mechanism
(--fair-sched=no) is available on all
platforms. Pipe based locking does not guarantee fairness between
threads: it is quite likely that a thread that has just released the
lock reacquires it immediately, even though other threads are ready to
run. When using pipe based locking, different runs of the same
multithreaded application might give very different thread
scheduling.
An alternative locking mechanism, based on futexes, is available
on some platforms. If available, it is activated
by --fair-sched=yes or
--fair-sched=try. Futex based locking ensures
fairness (round-robin scheduling) between threads: if multiple threads
are ready to run, the lock will be given to the thread which first
requested the lock. Note that a thread which is blocked in a system
call (e.g. in a blocking read system call) has not (yet) requested the
lock: such a thread requests the lock only after the system call is
finished.
The fairness of the futex based locking produces better reproducibility of thread scheduling for different executions of a multithreaded application. This better reproducibility is particularly helpful when using Helgrind or DRD.
Valgrind's use of thread serialisation implies that only one thread at a time may run. On a multiprocessor/multicore system, the running thread is assigned to one of the CPUs by the OS kernel scheduler. When a thread acquires the lock, sometimes the thread will be assigned to the same CPU as the thread that just released the lock. Sometimes, the thread will be assigned to another CPU. When using pipe based locking, the thread that just acquired the lock will usually be scheduled on the same CPU as the thread that just released the lock. With the futex based mechanism, the thread that just acquired the lock will more often be scheduled on another CPU.
Valgrind's thread serialisation and CPU assignment by the OS kernel scheduler can interact badly with the CPU frequency scaling available on many modern CPUs. To decrease power consumption, the frequency of a CPU or core is automatically decreased if the CPU/core has not been used recently. If the OS kernel often assigns the thread which just acquired the lock to another CPU/core, it is quite likely that this CPU/core is currently at a low frequency. The frequency of this CPU will be increased after some time. However, during this time, the (only) running thread will have run at the low frequency. Once this thread has run for some time, it will release the lock. Another thread will acquire this lock, and might be scheduled again on another CPU whose clock frequency was decreased in the meantime.
The futex based locking causes threads to change CPUs/cores more often. So, if CPU frequency scaling is activated, the futex based locking might decrease significantly the performance of a multithreaded app running under Valgrind. Performance losses of up to 50% degradation have been observed, as compared to running on a machine for which CPU frequency scaling has been disabled. The pipe based locking locking scheme also interacts badly with CPU frequency scaling, with performance losses in the range 10..20% having been observed.
To avoid such performance degradation, you should indicate to
the kernel that all CPUs/cores should always run at maximum clock
speed. Depending on your Linux distribution, CPU frequency scaling
may be controlled using a graphical interface or using command line
such as
cpufreq-selector or
cpufreq-set.
An alternative way to avoid these problems is to tell the
OS scheduler to tie a Valgrind process to a specific (fixed) CPU using the
taskset command. This should ensure
that the selected CPU does not fall below its maximum frequency
setting so long as any thread of the program has work to do.
Valgrind has a fairly complete signal implementation. It should be able to cope with any POSIX-compliant use of signals.
If you're using signals in clever ways (for example, catching
SIGSEGV, modifying page state and restarting the instruction), you're
probably relying on precise exceptions. In this case, you will need
to use --vex-iropt-register-updates=allregs-at-mem-access
or --vex-iropt-register-updates=allregs-at-each-insn.
If your program dies as a result of a fatal core-dumping signal,
Valgrind will generate its own core file
(vgcore.NNNNN) containing your program's
state. You may use this core file for post-mortem debugging with GDB or
similar. (Note: it will not generate a core if your core dump size limit is
0.) At the time of writing the core dumps do not include all the floating
point register information.
In the unlikely event that Valgrind itself crashes, the operating system will create a core dump in the usual way.
An execution tree (xtree) is made of a set of stack traces, each stack trace is associated with some resource consumptions or event counts. Depending on the xtree, different event counts/resource consumptions can be recorded in the xtree. Multiple tools can produce memory use xtree. Memcheck can output the leak search results in an xtree.
A typical usage for an xtree is to show a graphical or textual representation of the heap usage of a program. The below figure is a heap usage xtree graphical representation produced by kcachegrind. In the kcachegrind output, you can see that main current heap usage (allocated indirectly) is 528 bytes : 388 bytes allocated indirectly via a call to function f1 and 140 bytes indirectly allocated via a call to function f2. f2 has allocated memory by calling g2, while f1 has allocated memory by calling g11 and g12. g11, g12 and g1 have directly called a memory allocation function (malloc), and so have a non zero 'Self' value. Note that when kcachegrind shows an xtree, the 'Called' column and call nr indications in the Call Graph are not significant (always set to 0 or 1, independently of the real nr of calls. The kcachegrind versions >= 0.8.0 do not show anymore such irrelevant xtree call number information.
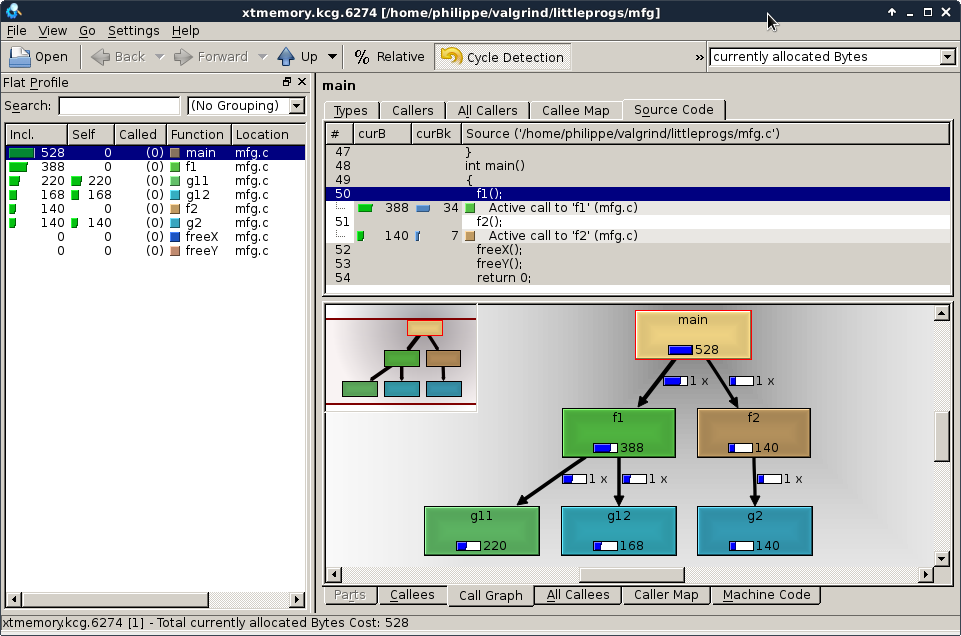
An xtree heap memory report is produced at the end of the
execution when required using the
option --xtree-memory. It can also be produced on
demand using the xtmemory monitor command (see
Valgrind monitor commands). Currently,
an xtree heap memory report can be produced by
the memcheck, helgrind
and massif tools.
The xtrees produced by the option
--xtree-memory or the xtmemory
monitor command are showing the following events/resource
consumption describing heap usage:
curB current number of Bytes allocated. The
number of allocated bytes is added to the curB
value of a stack trace for each allocation. It is decreased when
a block allocated by this stack trace is released (by another
"freeing" stack trace)
curBk current number of Blocks allocated,
maintained similary to curB : +1 for each allocation, -1 when
the block is freed.
totB total allocated Bytes. This is
increased for each allocation with the number of allocated bytes.
totBk total allocated Blocks, maintained similary
to totB : +1 for each allocation.
totFdB total Freed Bytes, increased each time
a block is released by this ("freeing") stack trace : + nr freed bytes
for each free operation.
totFdBk total Freed Blocks, maintained similarly
to totFdB : +1 for each free operation.
Note that the last 4 counts are produced only when the
--xtree-memory=full was given at startup.
Xtrees can be saved in 2 file formats, the "Callgrind Format" and the "Massif Format".
Callgrind Format
An xtree file in the Callgrind Format contains a single callgraph, associating each stack trace with the values recorded in the xtree.
Different Callgrind Format file visualisers are available:
Valgrind distribution includes the callgrind_annotate
command line utility that reads in the xtree data, and prints a sorted
lists of functions, optionally with source annotation. Note that due to
xtree specificities, you must give the option
--inclusive=yes to callgrind_annotate.
For graphical visualization of the data, you can use KCachegrind, which is a KDE/Qt based GUI that makes it easy to navigate the large amount of data that an xtree can contain.
Note that xtree Callgrind Format does not make use of the inline
information even when specifying --read-inline-info=yes.
Massif Format
An xtree file in the Massif Format contains one detailed tree
callgraph data for each type of event recorded in the xtree. So,
for --xtree-memory=alloc, the output file will
contain 2 detailed trees (for the counts curB
and curBk),
while --xtree-memory=full will give a file
with 6 detailed trees.
Different Massif Format file visualisers are available. Valgrind
distribution includes the ms_print
command line utility that produces an easy to read reprentation of
a massif output file. See Using Massif and ms_print and
Using massif-visualizer for more details
about visualising Massif Format output files.
Note that xtree Massif Format makes use of the inline
information when specifying --read-inline-info=yes.
Note that for equivalent information, the Callgrind Format is more compact
than the Massif Format. However, the Callgrind Format always contains the
full data: there is no filtering done during file production, filtering is
done by visualisers such as kcachegrind. kcachegrind is particularly easy to
use to analyse big xtree data containing multiple events counts or resources
consumption. The Massif Format (optionally) only contains a part of the data.
For example, the Massif tool might filter some of the data, according to the
--threshold option.
To clarify the xtree concept, the below gives several extracts of the output produced by the following commands:
valgrind --xtree-memory=full --xtree-memory-file=xtmemory.kcg mfg
callgrind_annotate --auto=yes --inclusive=yes --sort=curB:100,curBk:100,totB:100,totBk:100,totFdB:100,totFdBk:100  xtmemory.kcg
The below extract shows that the program mfg has allocated in total 770 bytes in 60 different blocks. Of these 60 blocks, 19 were freed, releasing a total of 242 bytes. The heap currently contains 528 bytes in 41 blocks.
--------------------------------------------------------------------------------
curB curBk totB totBk totFdB totFdBk
--------------------------------------------------------------------------------
 528    41  770    60    242      19  PROGRAM TOTALS
The below gives more details about which functions have allocated or released memory. As an example, we see that main has (directly or indirectly) allocated 770 bytes of memory and freed (directly or indirectly) 242 bytes of memory. The function f1 has (directly or indirectly) allocated 570 bytes of memory, and has not (directly or indirectly) freed memory. Of the 570 bytes allocated by function f1, 388 bytes (34 blocks) have not been released.
--------------------------------------------------------------------------------
curB curBk totB totBk totFdB totFdBk  file:function
--------------------------------------------------------------------------------
 528    41  770    60    242      19  mfg.c:main
 388    34  570    50      0       0  mfg.c:f1
 220    20  330    30      0       0  mfg.c:g11
 168    14  240    20      0       0  mfg.c:g12
 140     7  200    10      0       0  mfg.c:g2
 140     7  200    10      0       0  mfg.c:f2
   0     0    0     0    131      10  mfg.c:freeY
   0     0    0     0    111       9  mfg.c:freeX
The below gives a more detailed information about the callgraph and which source lines/calls have (directly or indirectly) allocated or released memory. The below shows that the 770 bytes allocated by main have been indirectly allocated by calls to f1 and f2. Similarly, we see that the 570 bytes allocated by f1 have been indirectly allocated by calls to g11 and g12. Of the 330 bytes allocated by the 30 calls to g11, 168 bytes have not been freed. The function freeY (called once by main) has released in total 10 blocks and 131 bytes.
--------------------------------------------------------------------------------
-- Auto-annotated source: /home/philippe/valgrind/littleprogs/ + mfg.c
--------------------------------------------------------------------------------
curB curBk totB totBk totFdB totFdBk
....
   .     .    .     .      .       .  static void freeY(void)
   .     .    .     .      .       .  {
   .     .    .     .      .       .     int i;
   .     .    .     .      .       .     for (i = 0; i < next_ptr; i++)
   .     .    .     .      .       .        if(i % 5 == 0 && ptrs[i] != NULL)
   0     0    0     0    131      10           free(ptrs[i]);
   .     .    .     .      .       .  }
   .     .    .     .      .       .  static void f1(void)
   .     .    .     .      .       .  {
   .     .    .     .      .       .     int i;
   .     .    .     .      .       .     for (i = 0; i < 30; i++)
 220    20  330    30      0       0        g11();
   .     .    .     .      .       .     for (i = 0; i < 20; i++)
 168    14  240    20      0       0        g12();
   .     .    .     .      .       .  }
   .     .    .     .      .       .  int main()
   .     .    .     .      .       .  {
 388    34  570    50      0       0     f1();
 140     7  200    10      0       0     f2();
   0     0    0     0    111       9     freeX();
   0     0    0     0    131      10     freeY();
   .     .    .     .      .       .     return 0;
   .     .    .     .      .       .  }
Heap memory xtrees are helping to understand how your (big) program is using the heap. A full heap memory xtree helps to pin point some code that allocates a lot of small objects : allocating such small objects might be replaced by more efficient technique, such as allocating a big block using malloc, and then diviving this block into smaller blocks in order to decrease the cpu and/or memory overhead of allocating a lot of small blocks. Such full xtree information complements e.g. what callgrind can show: callgrind can show the number of calls to a function (such as malloc) but does not indicate the volume of memory allocated (or freed).
A full heap memory xtree also can identify the code that allocates and frees a lot of blocks : the total foot print of the program might not reflect the fact that the same memory was over and over allocated then released.
Finally, Xtree visualisers such as kcachegrind are helping to identify big memory consumers, in order to possibly optimise the amount of memory needed by your program.
We use the standard Unix
./configure,
make, make
install mechanism. Once you have completed
make install you may then want
to run the regression tests
with make regtest.
In addition to the usual
--prefix=/path/to/install/tree, there are three
options which affect how Valgrind is built:
--enable-inner
This builds Valgrind with some special magic hacks which make it possible to run it on a standard build of Valgrind (what the developers call "self-hosting"). Ordinarily you should not use this option as various kinds of safety checks are disabled.
--enable-only64bit
--enable-only32bit
On 64-bit platforms (amd64-linux, ppc64-linux, amd64-darwin), Valgrind is by default built in such a way that both 32-bit and 64-bit executables can be run. Sometimes this cleverness is a problem for a variety of reasons. These two options allow for single-target builds in this situation. If you issue both, the configure script will complain. Note they are ignored on 32-bit-only platforms (x86-linux, ppc32-linux, arm-linux, x86-darwin).
The configure script tests
the version of the X server currently indicated by the current
$DISPLAY. This is a known bug.
The intention was to detect the version of the current X
client libraries, so that correct suppressions could be selected
for them, but instead the test checks the server version. This
is just plain wrong.
If you are building a binary package of Valgrind for
distribution, please read README_PACKAGERS
Readme Packagers. It contains some
important information.
Apart from that, there's not much excitement here. Let us know if you have build problems.
Contact us at http://www.valgrind.org/.
See Limitations for the known limitations of Valgrind, and for a list of programs which are known not to work on it.
All parts of the system make heavy use of assertions and internal self-checks. They are permanently enabled, and we have no plans to disable them. If one of them breaks, please mail us!
If you get an assertion failure
in m_mallocfree.c, this may have happened because
your program wrote off the end of a heap block, or before its
beginning, thus corrupting heap metadata. Valgrind hopefully will have
emitted a message to that effect before dying in this way.
Read the Valgrind FAQ for more advice about common problems, crashes, etc.
The following list of limitations seems long. However, most programs actually work fine.
Valgrind will run programs on the supported platforms subject to the following constraints:
On Linux, Valgrind determines at startup the size of the 'brk segment' using the RLIMIT_DATA rlim_cur, with a minimum of 1 MB and a maximum of 8 MB. Valgrind outputs a message each time a program tries to extend the brk segment beyond the size determined at startup. Most programs will work properly with this limit, typically by switching to the use of mmap to get more memory. If your program really needs a big brk segment, you must change the 8 MB hardcoded limit and recompile Valgrind.
On x86 and amd64, there is no support for 3DNow! instructions. If the translator encounters these, Valgrind will generate a SIGILL when the instruction is executed. Apart from that, on x86 and amd64, essentially all instructions are supported, up to and including AVX and AES in 64-bit mode and SSSE3 in 32-bit mode. 32-bit mode does in fact support the bare minimum SSE4 instructions needed to run programs on MacOSX 10.6 on 32-bit targets.
On ppc32 and ppc64, almost all integer, floating point and Altivec instructions are supported. Specifically: integer and FP insns that are mandatory for PowerPC, the "General-purpose optional" group (fsqrt, fsqrts, stfiwx), the "Graphics optional" group (fre, fres, frsqrte, frsqrtes), and the Altivec (also known as VMX) SIMD instruction set, are supported. Also, instructions from the Power ISA 2.05 specification, as present in POWER6 CPUs, are supported.
On ARM, essentially the entire ARMv7-A instruction set is supported, in both ARM and Thumb mode. ThumbEE and Jazelle are not supported. NEON, VFPv3 and ARMv6 media support is fairly complete.
If your program does its own memory management, rather than using malloc/new/free/delete, it should still work, but Memcheck's error checking won't be so effective. If you describe your program's memory management scheme using "client requests" (see The Client Request mechanism), Memcheck can do better. Nevertheless, using malloc/new and free/delete is still the best approach.
Valgrind's signal simulation is not as robust as it could be. Basic POSIX-compliant sigaction and sigprocmask functionality is supplied, but it's conceivable that things could go badly awry if you do weird things with signals. Workaround: don't. Programs that do non-POSIX signal tricks are in any case inherently unportable, so should be avoided if possible.
Machine instructions, and system calls, have been implemented on demand. So it's possible, although unlikely, that a program will fall over with a message to that effect. If this happens, please report all the details printed out, so we can try and implement the missing feature.
Memory consumption of your program is majorly increased whilst running under Valgrind's Memcheck tool. This is due to the large amount of administrative information maintained behind the scenes. Another cause is that Valgrind dynamically translates the original executable. Translated, instrumented code is 12-18 times larger than the original so you can easily end up with 150+ MB of translations when running (eg) a web browser.
Valgrind can handle dynamically-generated code just fine. If
you regenerate code over the top of old code (ie. at the same
memory addresses), if the code is on the stack Valgrind will
realise the code has changed, and work correctly. This is
necessary to handle the trampolines GCC uses to implemented nested
functions. If you regenerate code somewhere other than the stack,
and you are running on an 32- or 64-bit x86 CPU, you will need to
use the --smc-check=all option, and Valgrind will
run more slowly than normal. Or you can add client requests that
tell Valgrind when your program has overwritten code.
On other platforms (ARM, PowerPC) Valgrind observes and
honours the cache invalidation hints that programs are obliged to
emit to notify new code, and so self-modifying-code support should
work automatically, without the need
for --smc-check=all.
Valgrind has the following limitations in its implementation of x86/AMD64 floating point relative to IEEE754.
Precision: There is no support for 80 bit arithmetic. Internally, Valgrind represents all such "long double" numbers in 64 bits, and so there may be some differences in results. Whether or not this is critical remains to be seen. Note, the x86/amd64 fldt/fstpt instructions (read/write 80-bit numbers) are correctly simulated, using conversions to/from 64 bits, so that in-memory images of 80-bit numbers look correct if anyone wants to see.
The impression observed from many FP regression tests is that the accuracy differences aren't significant. Generally speaking, if a program relies on 80-bit precision, there may be difficulties porting it to non x86/amd64 platforms which only support 64-bit FP precision. Even on x86/amd64, the program may get different results depending on whether it is compiled to use SSE2 instructions (64-bits only), or x87 instructions (80-bit). The net effect is to make FP programs behave as if they had been run on a machine with 64-bit IEEE floats, for example PowerPC. On amd64 FP arithmetic is done by default on SSE2, so amd64 looks more like PowerPC than x86 from an FP perspective, and there are far fewer noticeable accuracy differences than with x86.
Rounding: Valgrind does observe the 4 IEEE-mandated rounding modes (to nearest, to +infinity, to -infinity, to zero) for the following conversions: float to integer, integer to float where there is a possibility of loss of precision, and float-to-float rounding. For all other FP operations, only the IEEE default mode (round to nearest) is supported.
Numeric exceptions in FP code: IEEE754 defines five types of numeric exception that can happen: invalid operation (sqrt of negative number, etc), division by zero, overflow, underflow, inexact (loss of precision).
For each exception, two courses of action are defined by IEEE754: either (1) a user-defined exception handler may be called, or (2) a default action is defined, which "fixes things up" and allows the computation to proceed without throwing an exception.
Currently Valgrind only supports the default fixup actions. Again, feedback on the importance of exception support would be appreciated.
When Valgrind detects that the program is trying to exceed any
of these limitations (setting exception handlers, rounding mode, or
precision control), it can print a message giving a traceback of
where this has happened, and continue execution. This behaviour used
to be the default, but the messages are annoying and so showing them
is now disabled by default. Use --show-emwarns=yes to see
them.
The above limitations define precisely the IEEE754 'default' behaviour: default fixup on all exceptions, round-to-nearest operations, and 64-bit precision.
Valgrind has the following limitations in its implementation of x86/AMD64 SSE2 FP arithmetic, relative to IEEE754.
Essentially the same: no exceptions, and limited observance of rounding mode. Also, SSE2 has control bits which make it treat denormalised numbers as zero (DAZ) and a related action, flush denormals to zero (FTZ). Both of these cause SSE2 arithmetic to be less accurate than IEEE requires. Valgrind detects, ignores, and can warn about, attempts to enable either mode.
Valgrind has the following limitations in its implementation of ARM VFPv3 arithmetic, relative to IEEE754.
Essentially the same: no exceptions, and limited observance of rounding mode. Also, switching the VFP unit into vector mode will cause Valgrind to abort the program -- it has no way to emulate vector uses of VFP at a reasonable performance level. This is no big deal given that non-scalar uses of VFP instructions are in any case deprecated.
Valgrind has the following limitations in its implementation of PPC32 and PPC64 floating point arithmetic, relative to IEEE754.
Scalar (non-Altivec): Valgrind provides a bit-exact emulation of all floating point instructions, except for "fre" and "fres", which are done more precisely than required by the PowerPC architecture specification. All floating point operations observe the current rounding mode.
However, fpscr[FPRF] is not set after each operation. That could be done but would give measurable performance overheads, and so far no need for it has been found.
As on x86/AMD64, IEEE754 exceptions are not supported: all floating point exceptions are handled using the default IEEE fixup actions. Valgrind detects, ignores, and can warn about, attempts to unmask the 5 IEEE FP exception kinds by writing to the floating-point status and control register (fpscr).
Vector (Altivec, VMX): essentially as with x86/AMD64 SSE/SSE2: no exceptions, and limited observance of rounding mode. For Altivec, FP arithmetic is done in IEEE/Java mode, which is more accurate than the Linux default setting. "More accurate" means that denormals are handled properly, rather than simply being flushed to zero.
Programs which are known not to work are:
emacs starts up but immediately concludes it is out of
memory and aborts. It may be that Memcheck does not provide
a good enough emulation of the
mallinfo function.
Emacs works fine if you build it to use
the standard malloc/free routines.
This is the log for a run of a small program using Memcheck. The program is in fact correct, and the reported error is as the result of a potentially serious code generation bug in GNU g++ (snapshot 20010527).
sewardj@phoenix:~/newmat10$ ~/Valgrind-6/valgrind -v ./bogon
==25832== Valgrind 0.10, a memory error detector for x86 RedHat 7.1.
==25832== Copyright (C) 2000-2001, and GNU GPL'd, by Julian Seward.
==25832== Startup, with flags:
==25832== --suppressions=/home/sewardj/Valgrind/redhat71.supp
==25832== reading syms from /lib/ld-linux.so.2
==25832== reading syms from /lib/libc.so.6
==25832== reading syms from /mnt/pima/jrs/Inst/lib/libgcc_s.so.0
==25832== reading syms from /lib/libm.so.6
==25832== reading syms from /mnt/pima/jrs/Inst/lib/libstdc++.so.3
==25832== reading syms from /home/sewardj/Valgrind/valgrind.so
==25832== reading syms from /proc/self/exe
==25832==
==25832== Invalid read of size 4
==25832==    at 0x8048724: BandMatrix::ReSize(int,int,int) (bogon.cpp:45)
==25832==    by 0x80487AF: main (bogon.cpp:66)
==25832==  Address 0xBFFFF74C is not stack'd, malloc'd or free'd
==25832==
==25832== ERROR SUMMARY: 1 errors from 1 contexts (suppressed: 0 from 0)
==25832== malloc/free: in use at exit: 0 bytes in 0 blocks.
==25832== malloc/free: 0 allocs, 0 frees, 0 bytes allocated.
==25832== For a detailed leak analysis, rerun with: --leak-check=yes
The GCC folks fixed this about a week before GCC 3.0 shipped.
Some of these only appear if you run in verbose mode
(enabled by -v):
More than 100 errors detected.  Subsequent
    errors will still be recorded, but in less detail than
    before.
After 100 different errors have been shown, Valgrind becomes more conservative about collecting them. It then requires only the program counters in the top two stack frames to match when deciding whether or not two errors are really the same one. Prior to this point, the PCs in the top four frames are required to match. This hack has the effect of slowing down the appearance of new errors after the first 100. The 100 constant can be changed by recompiling Valgrind.
More than 1000 errors detected.  I'm not
    reporting any more.  Final error counts may be inaccurate.  Go fix
    your program!
After 1000 different errors have been detected, Valgrind ignores any more. It seems unlikely that collecting even more different ones would be of practical help to anybody, and it avoids the danger that Valgrind spends more and more of its time comparing new errors against an ever-growing collection. As above, the 1000 number is a compile-time constant.
Warning: client switching stacks?
Valgrind spotted such a large change in the stack pointer that it guesses the client is switching to a different stack. At this point it makes a kludgey guess where the base of the new stack is, and sets memory permissions accordingly. At the moment "large change" is defined as a change of more that 2000000 in the value of the stack pointer register. If Valgrind guesses wrong, you may get many bogus error messages following this and/or have crashes in the stack trace recording code. You might avoid these problems by informing Valgrind about the stack bounds using VALGRIND_STACK_REGISTER client request.
Warning: client attempted to close Valgrind's
    logfile fd <number>
Valgrind doesn't allow the client to close the logfile,
because you'd never see any diagnostic information after that point.
If you see this message, you may want to use the
--log-fd=<number> option to specify a
different logfile file-descriptor number.
Warning: noted but unhandled ioctl
    <number>
Valgrind observed a call to one of the vast family of
ioctl system calls, but did not
modify its memory status info (because nobody has yet written a
suitable wrapper). The call will still have gone through, but you may get
spurious errors after this as a result of the non-update of the
memory info.
Warning: set address range perms: large range
    <number>
Diagnostic message, mostly for benefit of the Valgrind developers, to do with memory permissions.